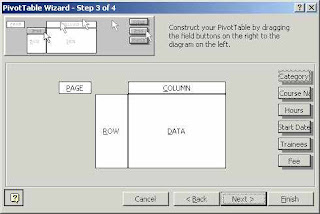
Let’s look at the PivotTable and why you should have this in your leadership tool box. The PivotTable is Excel’s most powerful analytical tool. PivotTables allow you to group, organize and summarize data with the click of the mouse. PivotTables can be used to analyze the data, make comparisons, detect patterns and relationships, and discover trends.
If PivotTables are so great, why do people avoid using them? I’m glad you asked. Many people avoid using PivotTables for one big reason -- PivotTables seems difficult to grasp. Just look at the finished charts and tables. The truth is, trying to learn how to use this tool from a novice user only makes PivotTables appear difficult. In reality, using the tool takes a little work, but it can be learned. Visit O’Reilly’s WindowDev Center to view lessons to create PivotTables. I also recommend going over to the Microsoft site for a self-paced course.
When you learn the tool and its benefits, you will be hooked. As a technology leader, I PivotTables allow me to organize failure and marketing data, and effectively identify trends. I’m thankful to the mentor, who years ago, recommended I add the tool to my tool box.
No comments:
Post a Comment